Learning about customer behavior is essential for a business as you can make changes to improve their experience on your website. It’s almost like having metaphorical cameras installed on your website, carefully watching your customer’s habits and preferences.
Among all the analytical tools, Hotjar is considered the best in helping you understand users better with its heatmaps and session recordings acting like those cameras just mentioned. So, let’s learn more about Hotjar and how it can help you get more and retain your old customers.
What Is Hotjar?
Hotjar is an all-in-one analytics and feedback tool to help marketers understand how users behave on their websites. Released in 2014 before getting its first customers the following year, Hotjar’s growth has shown just how popular this brilliant analytical tool has become.
What Does Hotjar Do?

Hotjar is a tool to uncover insights giving you behavior analytics and feedback data by collecting IP addresses, referring URLs and domains, device types, operating system and browser types, window size, and content.
With Hotjar, you can empathize with and understand your customers through its Heatmaps, Session Recordings, Surveys and Feedback widgets by adding a Hotjar Tracking Code (Hotjar script) to the <head> </head> of every page you want to track. This code is a JavaScript snippet unique to each web and mobile site.
The key selling point of Hotjar is that it combines a range of analytical features into one platform, removing the hassle of using multiple tools.
Here is the list of features that Hotjar has to offer:
Heatmaps – See Where Users Click, Move, And Scroll On Your Site
Hotjar heatmaps will record all user activities like scrolls, clicks, or taps on links, texts, or buttons and present it like a map with blue and red marks. A brighter color means more activity.

Hovering over the blue, red, and yellow marks shows how many clicks were made in that area. With this, you’ll get an idea of what attracted the users, what was ignored, and how users engage on the website.
Visitor Recordings – Map The Full User Journey
Hotjar is the first tool to feature the “Visitor Recording” option letting you record the screen of user sessions and see the exact user behavior on your website.

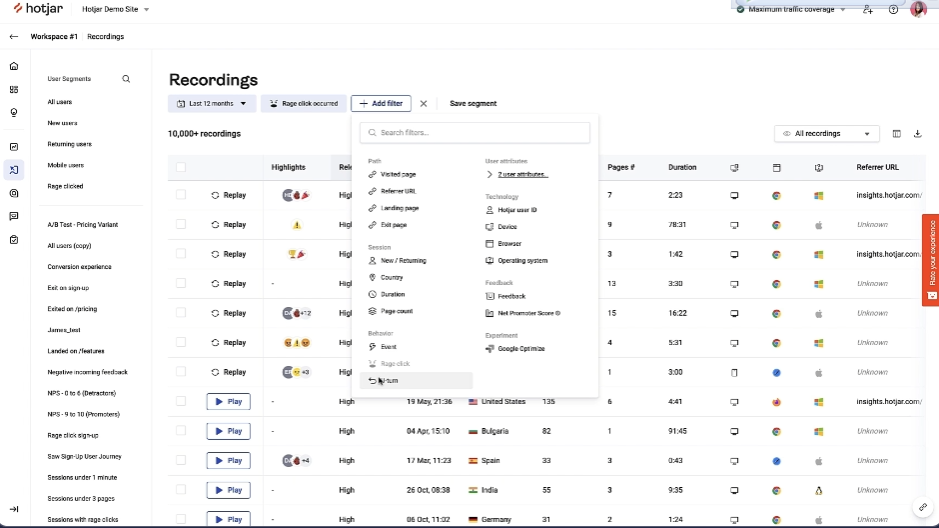
Seeing how users interact, including their scrolls, mouse, or swipe movement, gives you a better understanding of issues they face while navigating your website.
This feature comes in handy when you have released a new version and want to check how users react to it and use filters to find out what triggered the user to make rage clicks.
Live Feedback – Instant Visual Feedback For Your Website
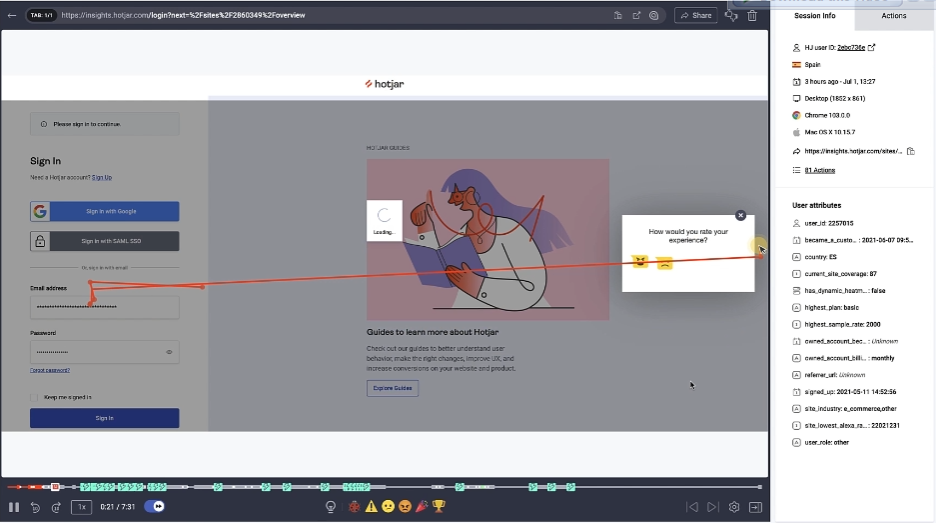
With this widget, you can place tabs, widgets, or feedback polls on your page, allowing users to rate their experience on your website. With the incoming feedback, you can improve the areas that they didn’t like the most.

Visitors can highlight the part they liked or disliked to leave instant visual feedback, allowing you to take measures before you start losing potential leads. You can even check what made a user leave negative feedback.
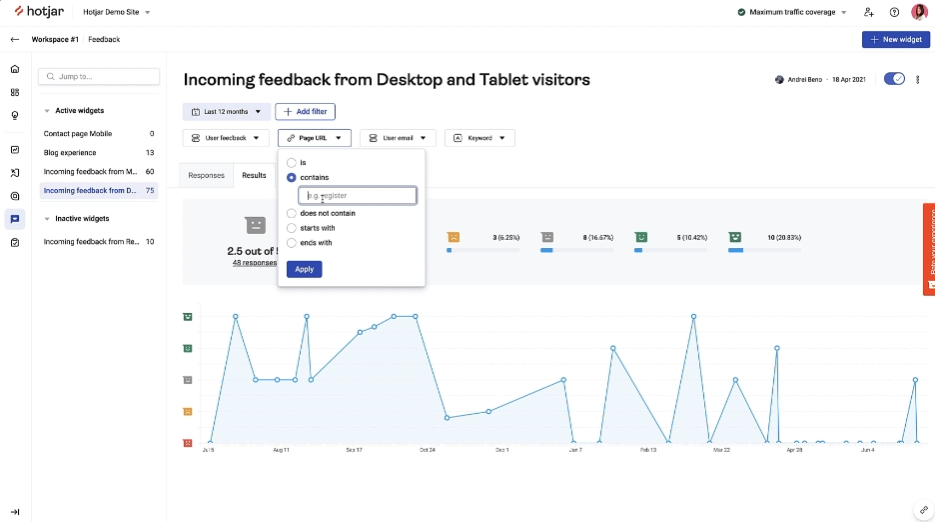
The benchmarks within live feedback let you compare the feedback score of every page to find out the underperforming parts of your site.
Surveys – Hear From The Users
Hotjar allows you to add internal and external survey forms to learn what the users have to say about your website. Using pop-ups or web links, you can send your surveys to the live users to capture in-moment feedback. With survey form analysis, you can better understand customer experience and make changes to improve it.
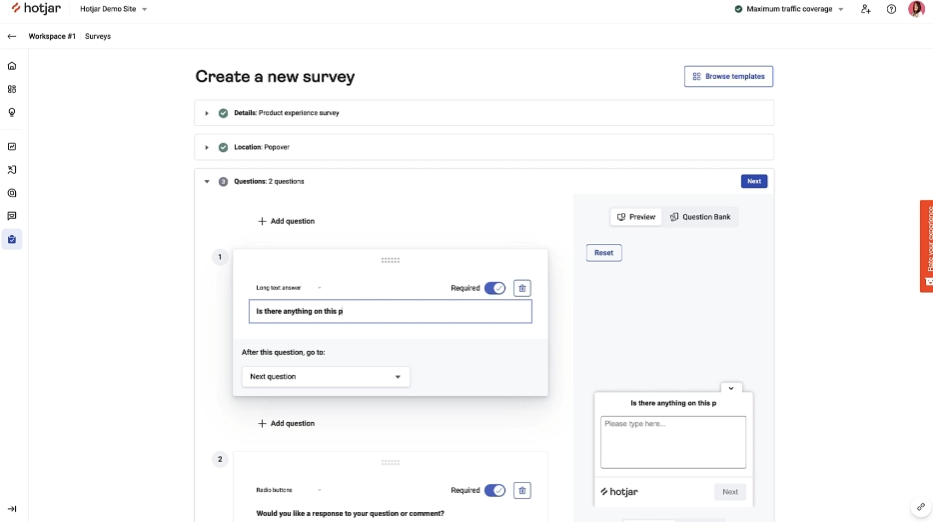
Even if this is your first time making a survey form, you can use Hotjar’s templates to build your own responsive surveys and get ideas from their question bank. Add questions to ask why users log in, what they like or dislike the most, or what improvements or changes they would like to see.

Engage – Recruit Test Users
Lets you engage with people by placing a widget on your websites asking them to participate in user testing. Anyone interested must fill out the basic information like name, age, and email address to become a participant. If you don’t have time, schedule an interview with them for another date, gather your team, and make and compare notes to turn insights into action.

Remember that Engage is still in its beta versions, so double-check your dates, times, and the users you recruited before confirming.
Hotjar Pricing And Plans
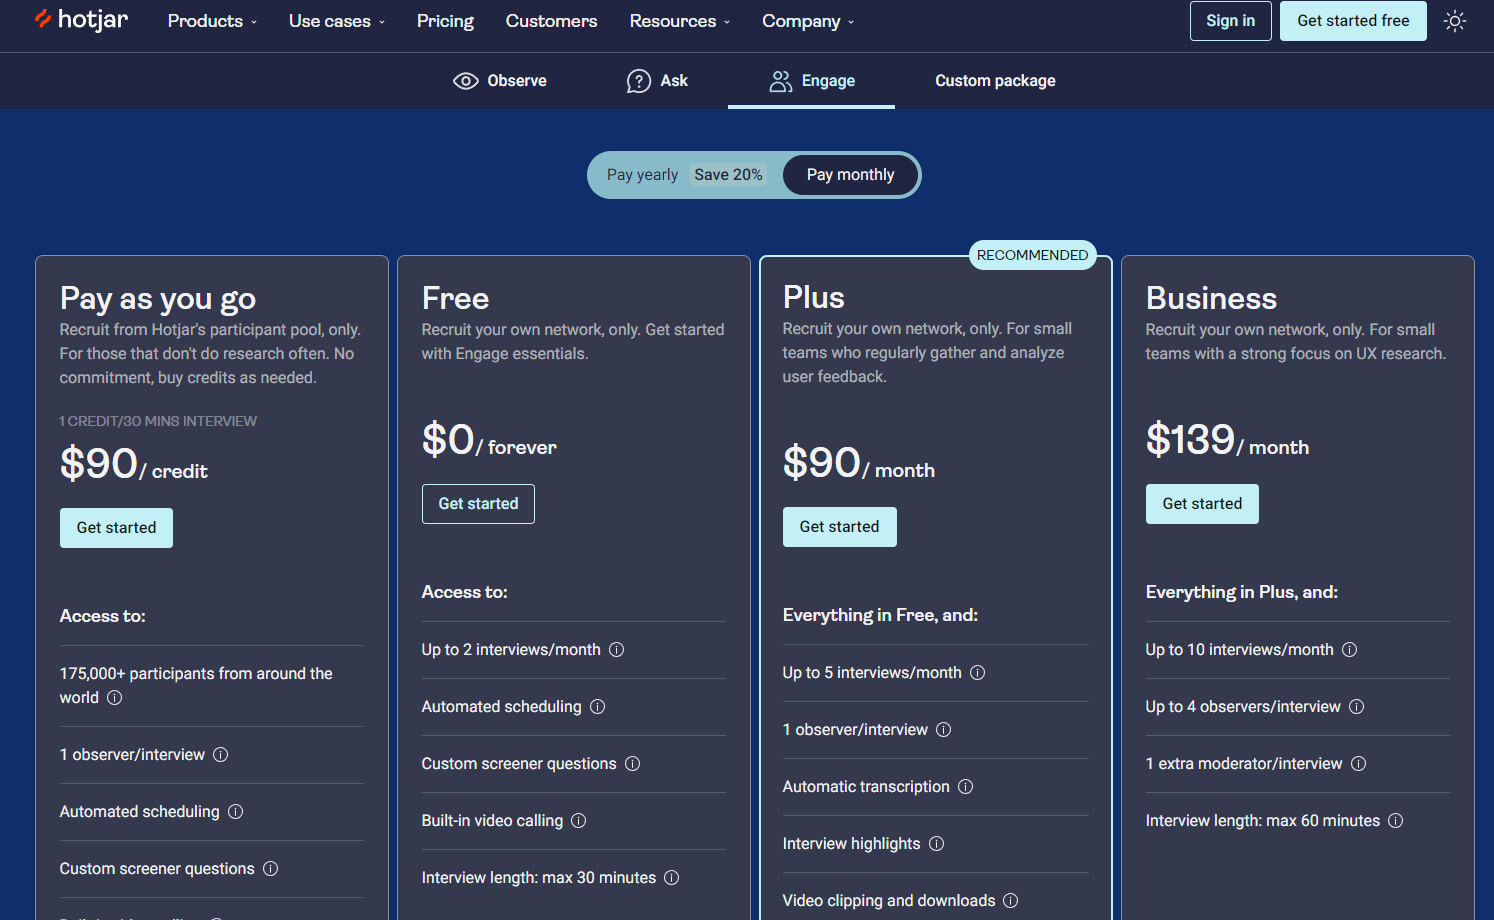
Hotjar has three pricing and plans categories, Observe, Ask, and Engage, each category having four price plans.
Hotjar Observe
Free – $99/mo+


Hotjar Ask
Free-$79/mo+


Hotjar Engage
Free-$149/mo+ or $90/credit

- Guarantees
Each plan allows you to add unlimited team members, offers free data storage for 365-days, and comes with a 30-day money-back guarantee. Opting for any premium Hotjar account gives you access to the other two basic plans. For example, if you choose the Hotjar Ask Plus plan, you get access to Observe and Engage basic plans. For anything else, you can contact Hotjar support.
Hotjar Key Stats
Users

According to Hotjar, more than 1,148,546 websites currently use this platform in over 180 countries. Overall, Hotjar was used on 2,994,249 websites.
Hotjar Key Stats
The USA is the top country where more than 520,296 websites are currently using Hotjar, followed by Brazil, the United Kingdom, the Netherlands, and Germany, having 77,327, 63,847, 46,015, and 30,390 active customers, respectively.
Hotjar Employees
This company has a global team of over 200 employees working remotely throughout Europe, the Americas, and Africa.
Hotjar Foundation
David Darmanin is the person who started this company in 2014 with the idea to help people make websites that their users would love.
Headquarters
The headquarters is located on Malta’s island, in the ‘heart’ of the Mediterranean.
Hotjar Funding And Acquisitions
Hotjar is a self-funded company, but on Sep 1, 2021, they were acquired by Contentsquare which raised $500 million in a Series E financing round during May 2021.
Contentsquare is a tool that anonymously tracks all mouse movements, clicks, and mobile interactions inside your site or app.
Google Analytics Vs Hotjar
Google Analytics
Google Analytics (GA) is a tool from Google helping you collect, analyze, and report website traffic data, available in free and enterprise versions.
The free version is ideal for individuals and small/medium size businesses, while the enterprise version is excellent for large-scale companies.
Benefits Of Google Analytics
Once installed, Google Analytics continuously records data, including every page view, bounce rate, user traffic source, visited pages, and more. With this data, you can dig deep into the traffic segments interacting with your website.
Google Analytics can help you:
- Compare how much traffic you get from SERP, paid ads, or social media.
- Check which web page or pages have the highest drop-off rate and which have the worst or best conversion rate.
- Analyze and determine which pages impact your goals the most—for example, pages with the highest traffic a customer visits before leaving.
- Let you know which country you get the most traffic and the highest conversion rate.
- Help you determine which product was the most successful in terms of purchases.
Drawbacks Of Google Analytics
While GA is an excellent tool for keeping a log of what is happening on your website; it can’t tell you anything from the user’s perspective. For example:
- What brought the potential customers to your website, and why are they leaving quickly?
- User interaction as they navigate through the pages.
- The missing information can add value to your web pages.
- Emotional reasons why visitors might have left your platform
Hotjar
Google Analytics tells you what is happening on your website, while Hotjar lets you know what and why it is happening. Hotjar gives context to GA’s data and answers questions regarding customer behavior.
Benefits Of Hotjar
The set of tools offered by Hotjar can help you determine why and how a customer arrived at your website. With Hotjar, you can find data like
- On which page was a customer stuck that made him leave the website? For example, it could be a non-responsive button, or they didn’t find the data they wanted.
- What customers want from your website or the product’s page.
- How customers interact with individual page elements and which part they like the most.
- What they liked and didn’t like the most on a particular page.
- What information did they want to find, and did they get it?
Drawbacks Of Hotjar
- Hotjar doesn’t have Predictive analytics that you can find in GA.
- While you can track funnels, behavior, and feedback, there is no way to track ROI or spending.
- Hotjar doesn’t segment customers automatically, so all the data is bunched up into one group.
Integrations
Hotjar offers more integration than GA, allowing you to see data from all sources in one place. With deeper integrations and more ways to add real-time evaluation, you can easily find the insights you need faster.
Pricing
Google Analytics is free, without any paid upgrades or hidden fees. Just visit the website, create a free account, embed GA with your website, and get customer information.
The Google Analytics 360 is paid, more suitable for large-scale businesses, and has a starting price of $12,500 per month or $150,000 per year.
Hotjar also has a free version, and its paid version is available at $39-$112 per month.
Should You Use Both?
Google Analytics and Hotjar are not opposite but have features that can be used together to grow your business. The Hotjar Google Analytics integration helps you to drill through your GA’s data to see your users’ experience inside Hotjar.
How Is Hotjar Legal
Hotjar is fully compliant with the General Data Protection Regulation (GDPR). The company also signs NDA with potential and current users/customers and suppliers to safeguard their confidential information.
Top 6 Hotjar Alternatives
1. Mouseflow

Mouseflow is a behavior analytics tool to optimize the website experience, used by more than 190,000 clients for all categories like digital marketing, UX, Product, Startups, and Enterprise.
Unlike many other tools, Mouseflow lets you review how your previous funnels and forms have performed, helping you answer questions as you go.
Mouseflow has a more robust heat map engine, giving you more than 10 data points per click. With basic and advanced filtering, integrations with Optimizely, friction score, and Google Optimize, Mouseflow have a complete behavior analytics tools ecosystem, regardless of which plan you choose.
Mouseflow also automatically identifies issues, helping you spend less time finding the problem and more time fixing it.
Pricing
$29 to $399/mo+

Pros
- The simplicity of the reporting
- Super easy to install on WordPress
- Track JS errors on your website automatically
- Scroll, attention, movement, and geo heat maps
- Mouseflow doesn’t throttle your data
Cons
- Hard to search for the right recording in the user interface
2. VWO

Launching in 2009, VWO was an optimization tool for A/B Testing that came with a visual editor and went through multiple updates as it grew.
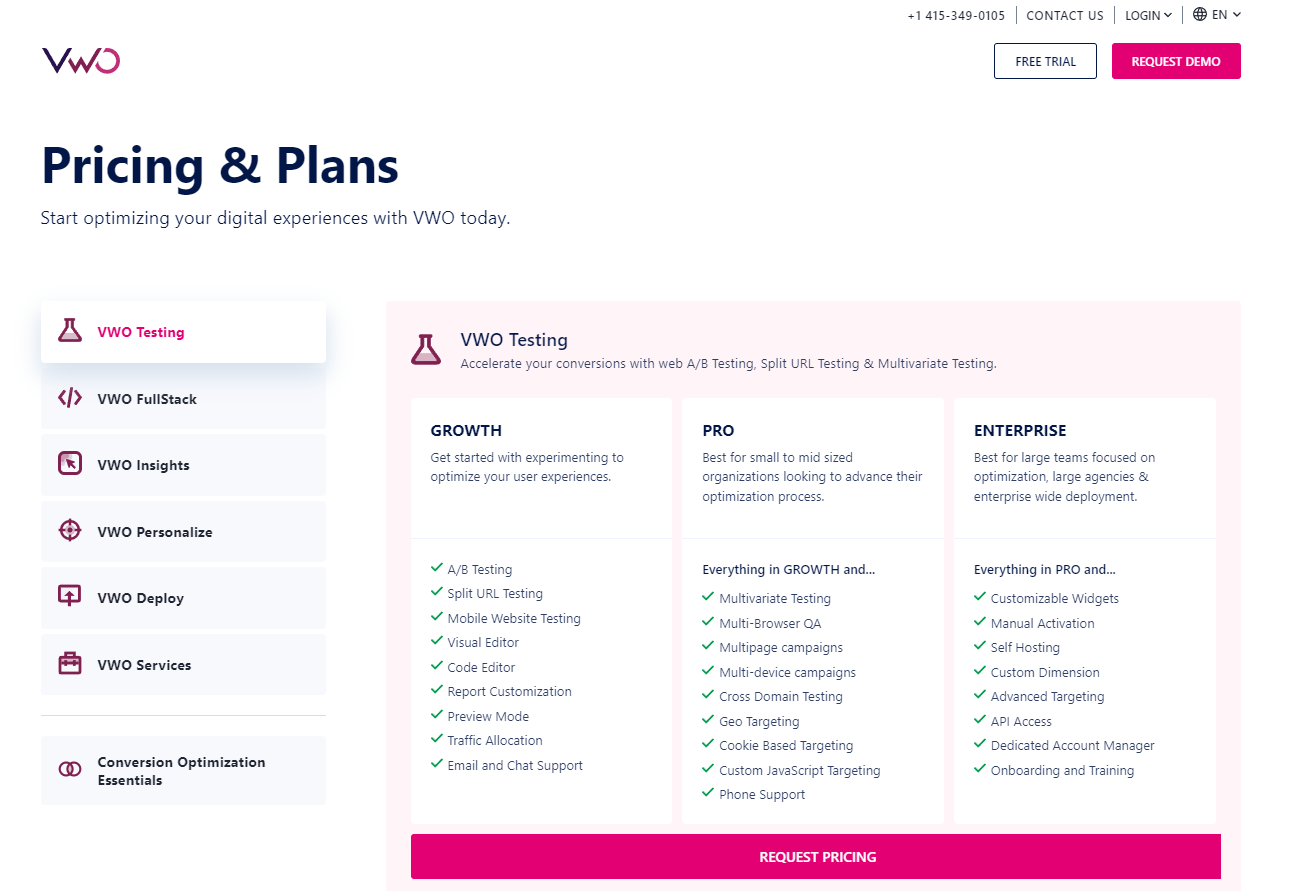
Now, VWO is a web testing and conversion optimization platform helping businesses to optimize their web experience to deliver a unique experience across desktop, mobile, and other devices.
This platform helps you research your customer’s behavior on your website, plan and conduct tests to increase engagement, and test how well these measures have worked.
Hotjar is more suitable for customers looking to monitor users and get customer feedback. VWO is ideal for enterprise & agency users looking for a fully featured data-driven website conversion tool.
Pricing
Contact Support
Pros
- Better ways to identify usability issues
- The visual editor helps make quick changes
- The support team is always available via chat in the web app
- Allow you to test small changes like headlines or images easily
- Good targeting behavioral options for all levels
Cons
- Some tests require advanced implementation through the code editor
3. Smartlook

Smartlook is an analytics software for websites and mobile apps allowing businesses to track customer behavior. This helps product managers, developers, UX designers, and marketers optimize their product performance.
The most noticeable thing about Smartlook compared to Hotjar is the compatibility with mobile apps and SDKs. Smartlook has SDKs for ten native mobile app platforms, frameworks, and engines, including React Native, Flutter, Unity, and Unreal Engine.
After installing their code snippet, Smartlook can automatically track all user interactions, including all events on your website.
Smartlook still helps you build funnels analyzing user journeys across your website and calculating conversion rates, while Hotjar stopped this service in 2020.
With features like events, funnels, and retention tables, you won’t need survey forms to understand your customer better.
Pricing
$39 – $111/mo+

Pros
- Always-on visitor recordings
- Automatic event tracking
- Multi-device compatible
- Conversion funnels
- In-context recordings
Cons
- It won’t archive recorded videos
4. Crazy Egg

Crazy Egg tracks how your visitors interact with your site using mouse-tracking technology, giving you a visual representation of user behavior. With Crazy Egg, you can learn where your users click the most, where they came from, which page element is most loved by them, and what they ignore.
The Scrollmap View of Crazy Egg shows how much time a user spends on which page and its sections, giving insight into which part they spend the most time on and which pages they didn’t bother checking.
Crazy Egg allows you to check for the errors that are stopping users from engaging further and provides feedback to improve them.
Pricing
$29-$249/mo+

Pros
- Scroll map tool
- In-page analytics
- A/B Testing
- Conversion rate optimization
- Design testing
Cons
- No month-to-month payment option
5. Microsoft Clarity
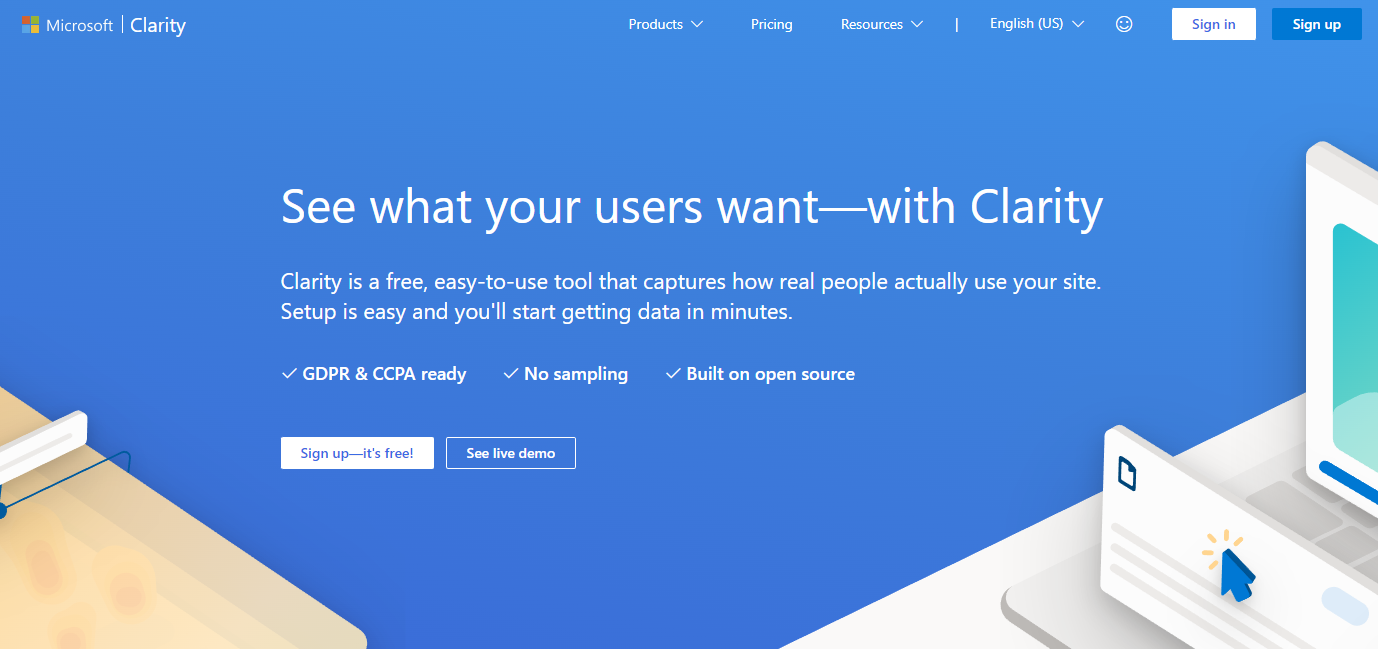
Microsoft Clarity is a user recording and heat mapping tool helping you to understand user engagement, user frustrations, and insights into devices, operating systems, and more.
The most significant benefit of Microsoft Clarity is that it is free and still offers many features that you get in the premium version of other analytics tools, like unlimited heatmaps, team members, and websites.
Integrate this tool with Google Analytics, and you can have full access to where users are coming from, what they do on your website, and what made them leave.
Pricing
Free

Pros
- Multi-device support
- Access to historical data
- Instant heatmap generation
- Always-on recordings
- Support for Ajax and single-page apps
Cons
- No A/B testing tools for UX testing
6. Zonka Feedback

Zonka Feedback is a customer feedback and experience management platform that is a powerful alternative to Hotjar Ask for collecting feedback through surveys. While Hotjar surveys are limited to website popups and feedback buttons, Zonka Feedback offers a wide range of web feedback widgets, including popups, slide-ups, bottom bars, web embeds, and various survey distribution channels both online and offline.
The platform also provides advanced user segmentation, behavior tracking, and targeting features so that you can deliver surveys to the right audience at key touchpoints in their journey.
You can automate surveys at predetermined intervals, trigger them based on specific events, and follow up with dissatisfied customers using its workflow automation.Its Voice of Customer (VoC) analytics offers qualitative insights that go beyond Hotjar’s click tracking. It enables you to explore customer comments, sentiments, and suggestions, gaining in-depth insights into user concerns. You can integrate this tool seamlessly with popular CRM systems like Salesforce, HubSpot, Zendesk, Freshdesk, and more for effortless data synchronization.
Pricing
- $49 – $199/month
- Free plan available
Pros
- Comprehensive solution for capturing and managing feedback
- 100+ customizable survey templates
- Microsurveys as well as long-form surveys with multiple questions
- More feedback widget options to choose from
- Seamless integration with popular CRMs
- Advanced analytics and reporting
- Multichannel support for understanding customer sentiments
- Workflow and CX automation
- User-friendly interface with multilanguage compatibility
- Cost-effective and flexible plans
Cons
- Limited website behavior analysis
- No heatmaps available
Final Words
With innovative screen recording capabilities to record user sessions and see precisely what’s working and what isn’t, Hotjar stands out as the best all-around option amongst the vast array of analytical tools available these days. Not only that, but you can also give customers an open hand to share their views about improving your website via survey forms, feedback polls, or live interviews.
